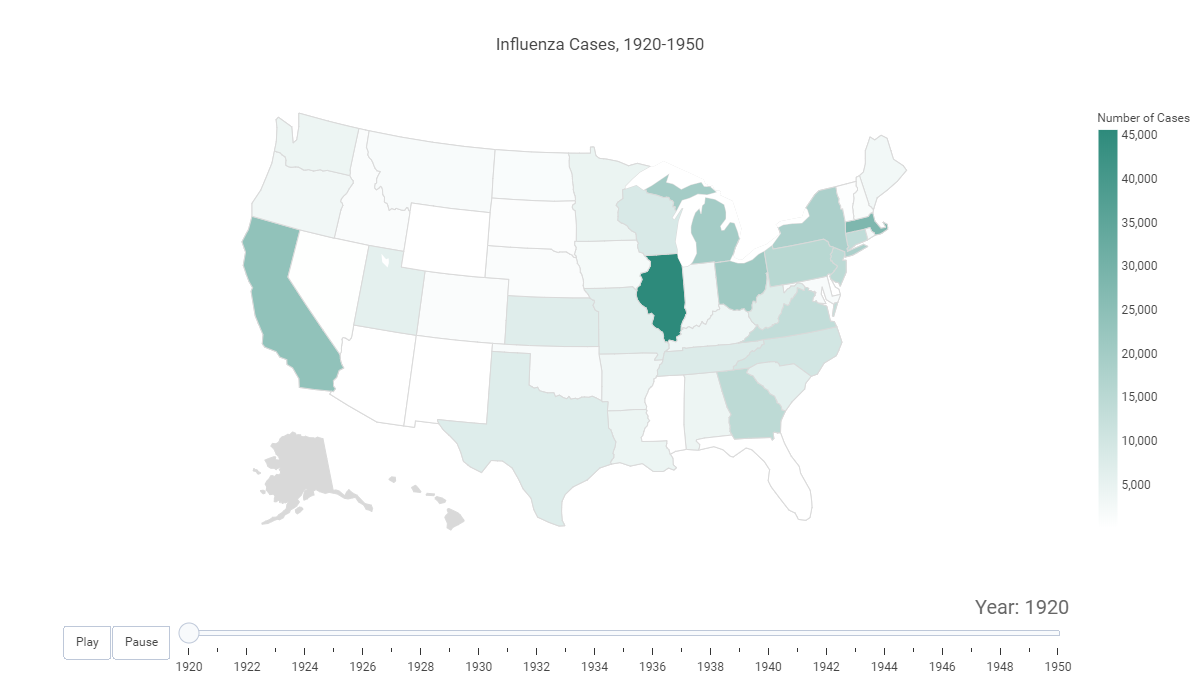
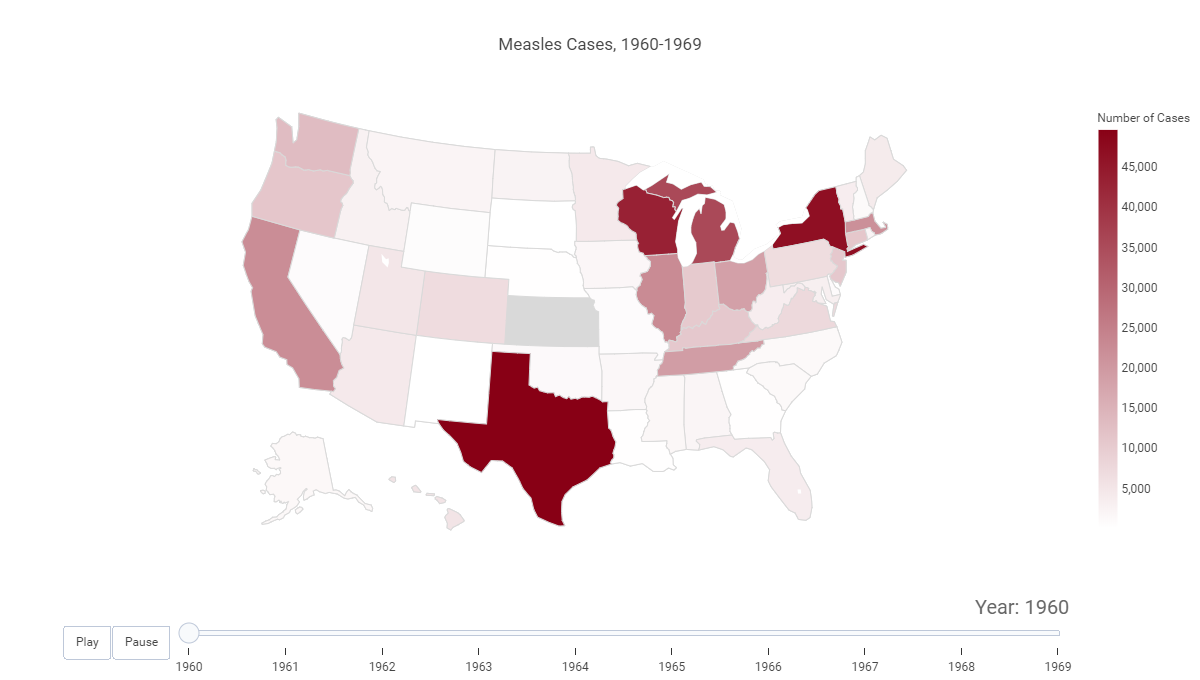
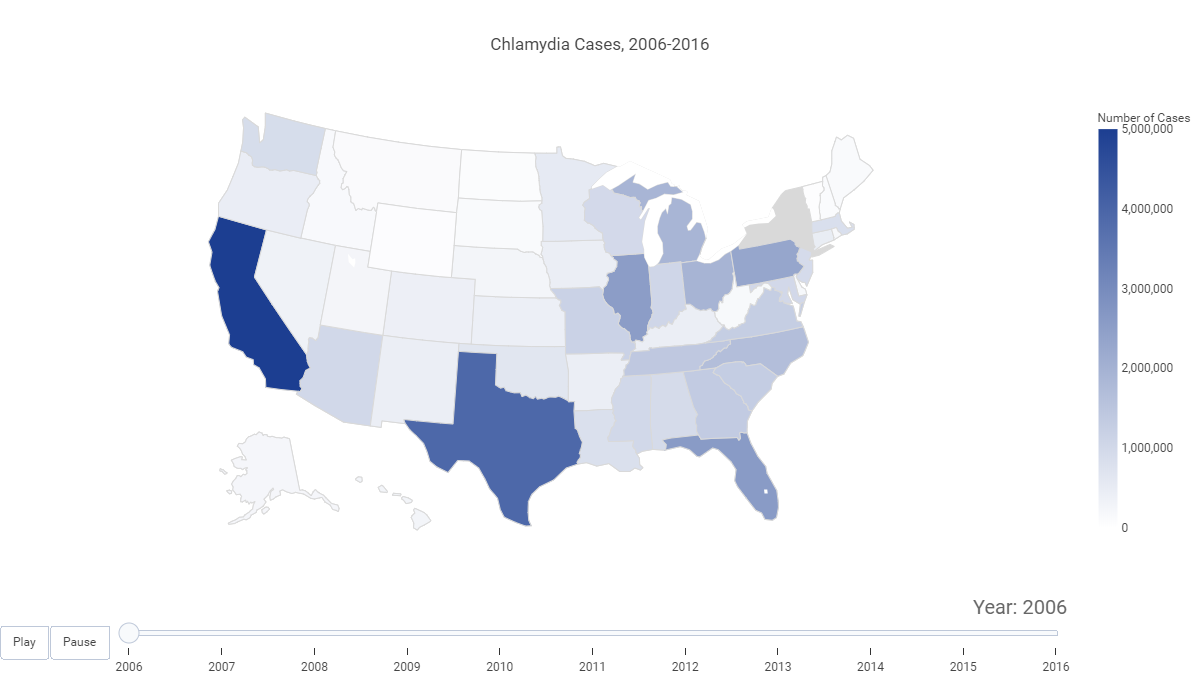
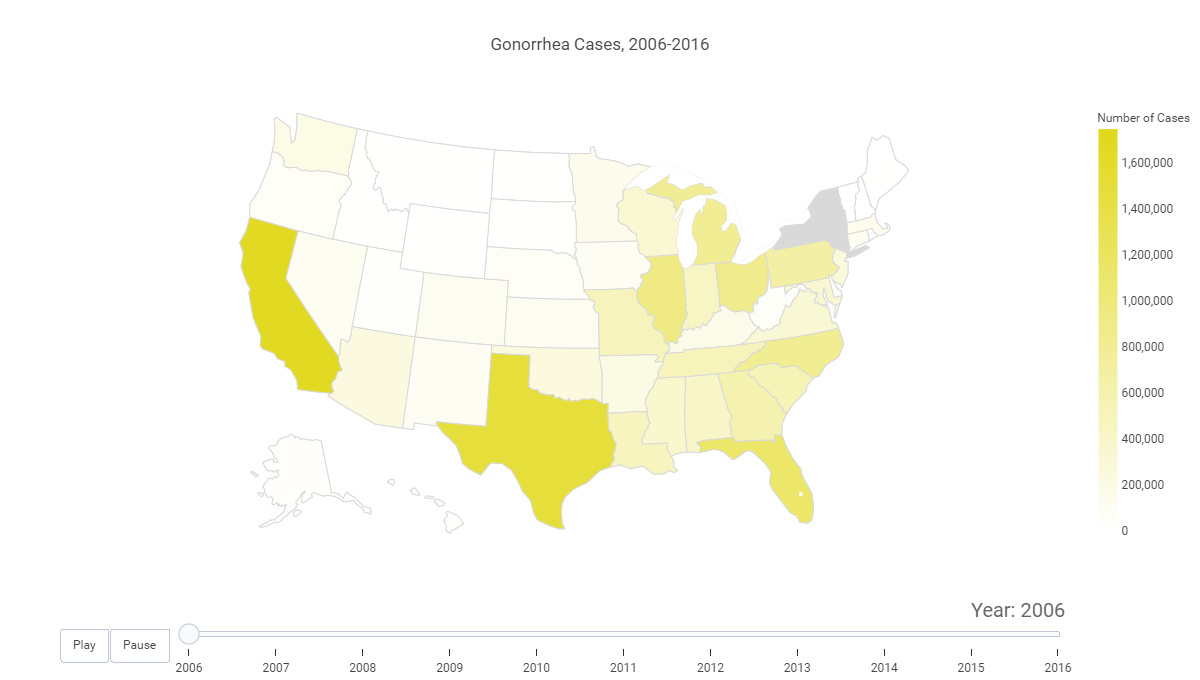
This is an exploratory analysis of four infectious diseases in the U.S. over time using data from Project Tycho, a compilation of standardized global datasets of infectious diseases.
The objective of this project was to visualize geographical data over time. I chose four infectious diseases that had a wide range of data among U.S. states over at least ten consecutive years. Then, I cleaned and prepared the data using Python and created mock-up visualizations in Plotly.js. Finally, I applied consistent formatting and color to the choropleths before deployment.
Made with: Python, pandas, JavaScript, Plotly.js
Source: Project Tycho