This is a descriptive and sentiment analysis of wine reviews scraped from WineEnthusiast found on Kaggle.
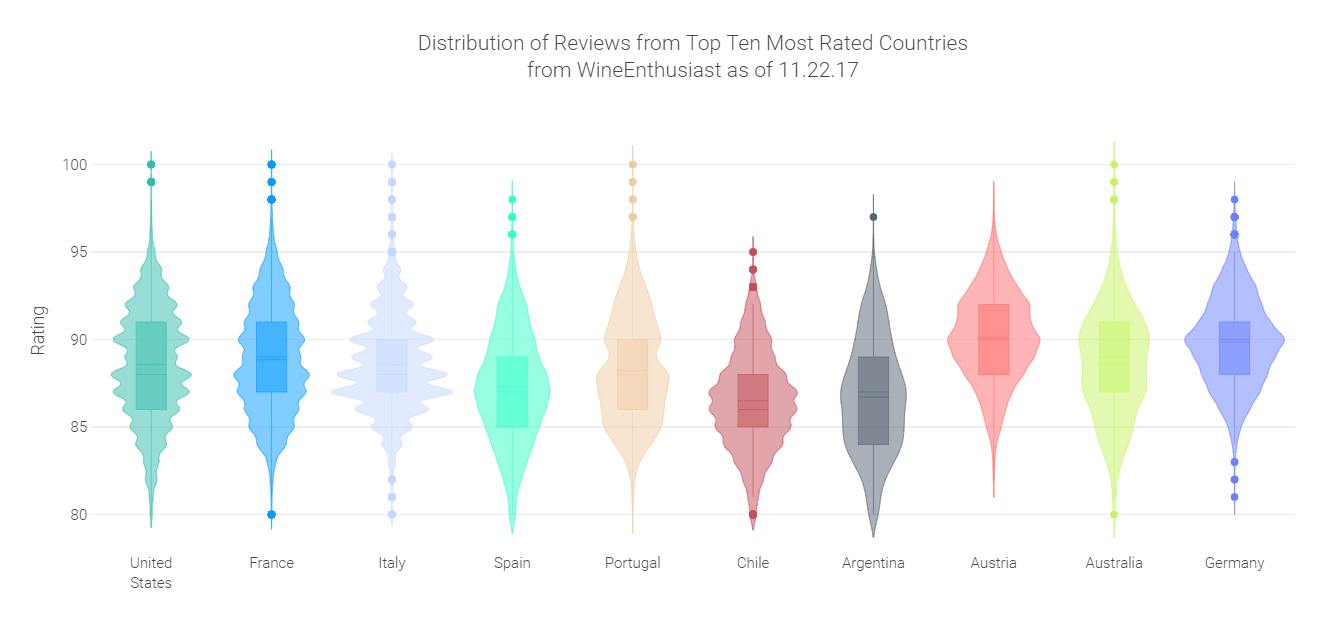
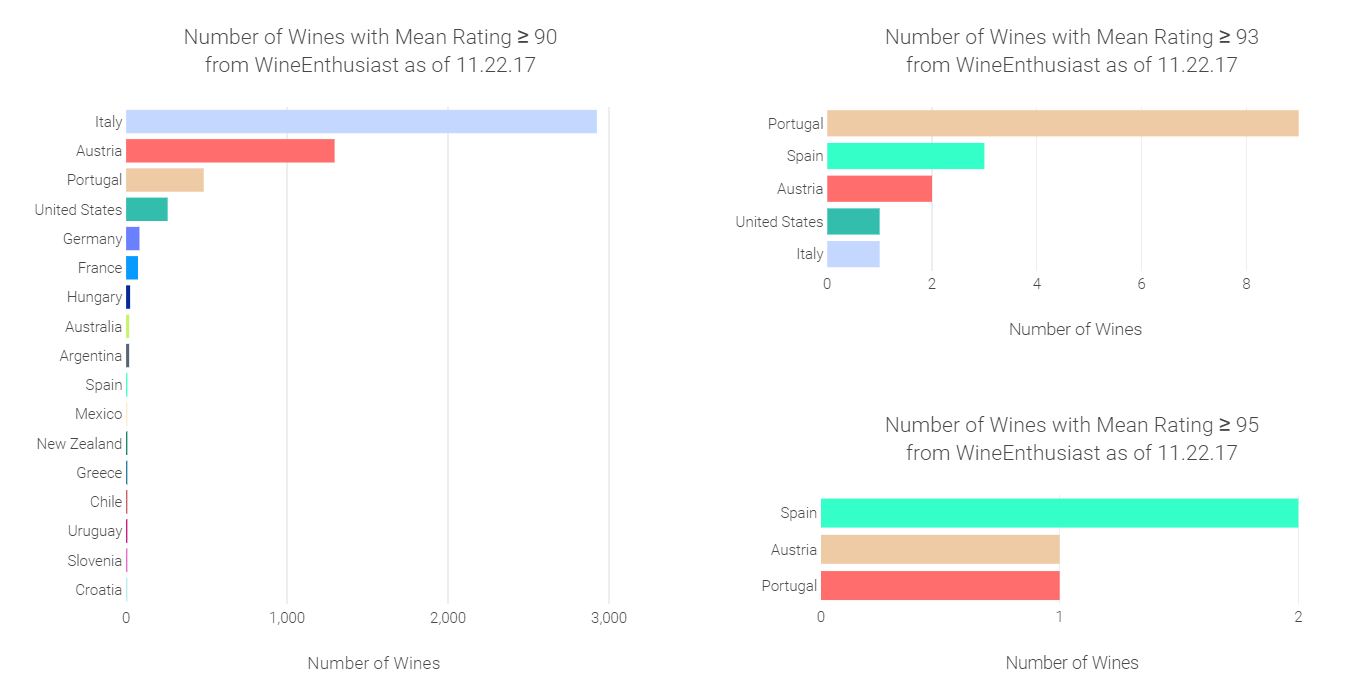
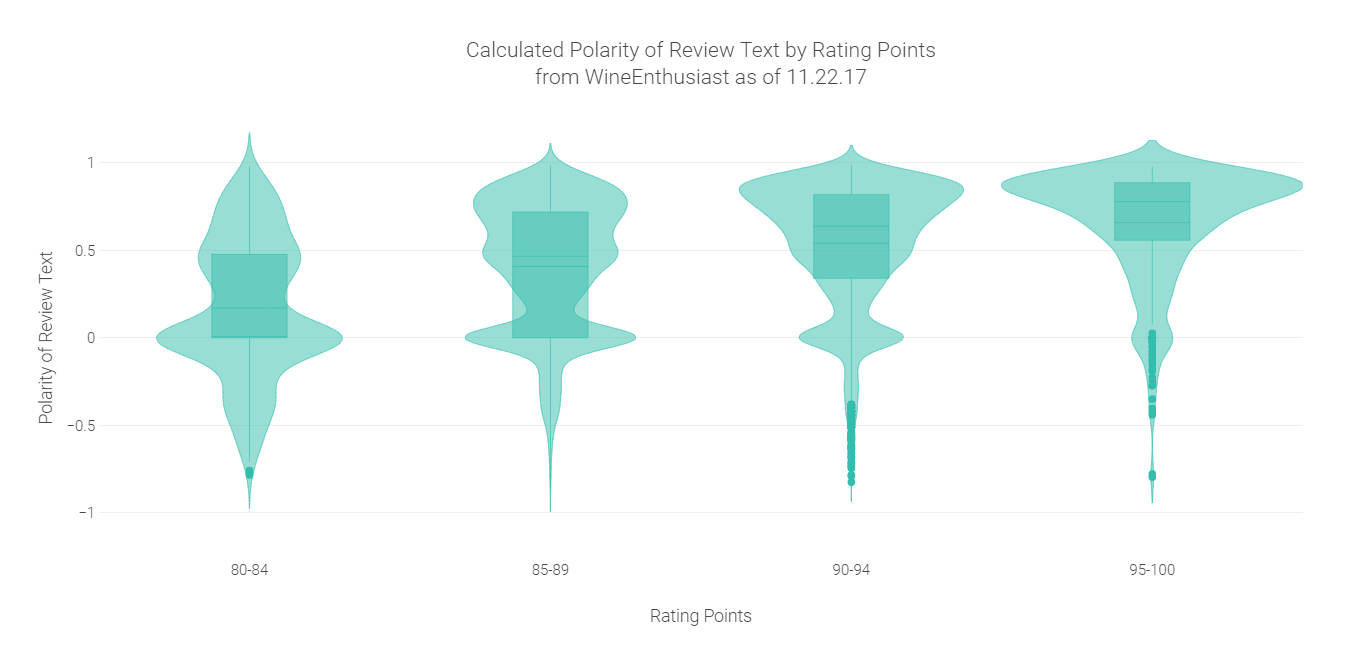
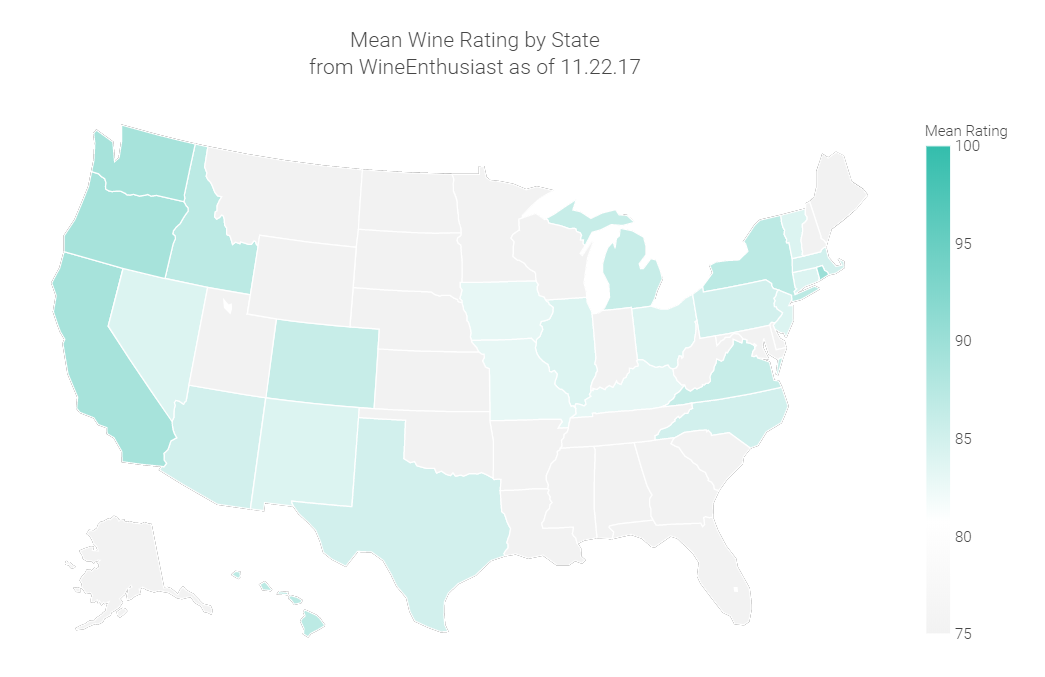
The objective of this analysis was to explore the relationships among: (1) rating points, (2) normalized, weighted composite polarity score of review text, and (3) location of origin.
After brainstorming interesting relationships to visualize and forming hypotheses, I cleaned and prepared the data using Python. Then, I created mock-up visualizations in Plotly.js and evaluated their usefulness. Finally, I applied consistent formatting and color to the series of visualizations before deployment.
Made with: Python, pandas, vaderSentiment, JavaScript, Plotly.js
Source: Kaggle